


TL;DR
- Strategic Thinking Engine: These advanced cognitive skills, including critical analysis, synthesis, and creative problem-solving, are essential for effective leadership, innovation, and navigating complex challenges.
- Structured Visual Frameworks: Specific charts like the Critical Thinking Skills Matrix, Bloom’s Taxonomy, and the T Chart offer distinct visual and hierarchical structures for categorising and intentionally advancing cognitive development.
- Maximising Cognitive Impact: These visual tools break down complexity, organise thought processes, and enhance retention, with their effectiveness depending on clear purpose, goal alignment, and guided reflection.
You’re in a meeting, trying to make sense of a complicated report. The numbers seem endless, and the details are hard to follow. But what if there was a way to make it simpler? That’s where charts come in, these visual tools can simplify the most complex ideas. In this blog, we’ll explore how charts not only break down information but also enhance your higher-order thinking skills.
What Are Higher Order Thinking Skills?
Higher-order thinking skills (HOTS) are what we use when we need to think critically, solve problems creatively, or make thoughtful decisions. For example, whether you’re brainstorming ideas for a new project, analysing a complex situation, or evaluating different options, you’re relying on HOTS. These skills go beyond simply remembering information. They help us connect ideas, adapt to challenges, and apply knowledge in meaningful ways.
This deeper level of thinking is captured in Bloom’s Taxonomy, a framework introduced by Benjamin Bloom in 1956, which organises thinking into levels. These levels range from basic recall of facts to more complex and sophisticated thinking. The first three levels are remembering, understanding, and applying, which focus on foundational cognitive skills. However, the final three levels – analysing, evaluating, and creating represent higher-order thinking. These stages require deep intellectual engagement and are often seen as critical for success in areas requiring innovation, strategic planning, and advanced problem-solving.

Components Of Higher Order Thinking Skills
Higher-order thinking skills are built on specific components that enable individuals to engage deeply with information and solve complex problems. These components include:

- Critical thinking: The ability to analyse information objectively, evaluate evidence, and make reasoned judgments.
- Creative thinking: Generating innovative ideas, solutions, or perspectives by thinking outside conventional boundaries.
- Problem-solving: Identifying challenges, exploring potential solutions, and implementing the best course of action.
- Decision-making: Weighing various options and choosing the most effective one based on evidence and reasoning.
- Analysing: Breaking down information into smaller parts to uncover patterns, relationships, and underlying principles.
- Evaluating: Assessing the validity or quality of information, arguments, or solutions to make informed conclusions.
- Applying knowledge: Using what you’ve learned in new situations or to solve practical problems.
- Synthesising: Combining different ideas or concepts to create something entirely new.
After examining the components of Higher-Order Thinking Skills, let’s now look at how these skills are represented through HOTS charts.
What Are Higher-Order Thinking Skills Charts?
Higher-Order Thinking Skills charts are tools designed to enhance critical thinking and decision-making by categorising skills like problem-solving, reasoning, analysis, and evaluation. These charts encourage individuals to move beyond routine thinking and adopt more strategic, adaptable approaches to challenges. The role of higher-order thinking skills can be seen in the following ways:
- Higher-Order Thinking Skills charts are used in education, leadership, and professional settings.
- They help individuals improve cognitive abilities and make more informed decisions.
- In leadership development, these charts provide a framework for the decision-making and strategic thinking required for effective leadership.
- By outlining different levels of thinking, these charts promote continuous development.
- The charts encourage individuals to tackle complex situations with a broader perspective.
With a clear understanding of Higher-Order Thinking Skills (HOTS) charts, let’s now explore the different types of charts available.
“I needed to enhance my personal brand and overcome my discomfort with public speaking and networking events. Kapable’s personalised sessions gave me the tools and confidence to handle these situations. Recently, I confidently participated in a panel discussion and a networking event, applying the skills I learned. My presentations are now more engaging, and public speaking feels natural, empowering my professional journey.”
– Shreyas Tonse (Founder At Zwayam)
What Are The Different Types Of Higher-Order Thinking Skills Charts?
Higher-order thinking skills (HOTS) are essential for deep learning, critical thinking, and problem-solving. Understanding and developing HOTS can enhance decision-making and creativity in various academic and professional settings. Below are charts outlining different types of higher-order thinking skills to help visualise and apply them effectively:

Bloom’s Taxonomy Chart
Bloom’s Taxonomy Chart is a hierarchical framework for categorising cognitive skills, structured as a pyramid or vertical hierarchy. The chart breaks down learning into six levels of cognitive development, progressing from basic to advanced thinking skills. The elements are as follows:

- Remembering: Recall facts and basic concepts.
- Understanding: Explaining ideas or concepts.
- Applying: Using information in new situations.
- Analysing: Breaking down information into parts and understanding relationships.
- Evaluating: Making judgments based on criteria.
- Creating: Assembling information in new ways to generate ideas.
It helps educators design curricula and assessments that target varying levels of cognitive skills. It also provides a clear structure for setting learning objectives. These charts also facilitate the development of activities that move learners through progressively complex levels of thinking.
Thinking Skills Hierarchy
The Thinking Skills Hierarchy is a vertical structure that displays the progression of thinking skills, starting from basic skills at the bottom and advancing to more complex skills at the top. This chart illustrates how thinking skills develop over time. The elements are as follows:

- Basic skills: Simple tasks like identifying, recalling, or recognising information.
- Intermediate skills: Analysing, organising, and comparing information.
- Advanced skills: Synthesising, evaluating, and solving complex problems.
Higher-order thinking skills are valuable in tracking learners’ cognitive development and identifying skill gaps. They guide curriculum development by ensuring skills are built progressively and help structure lessons and activities that challenge students as they grow, promoting deeper engagement and critical thinking.
Critical Thinking Skills Matrix
The Critical Thinking Skills Matrix is a tool that organises key components of critical thinking in a grid format, typically 2×2 or 3×3. The rows represent different levels of thinking depth, from basic analysis to deeper evaluation, while the columns highlight important aspects of thinking, such as questioning, reasoning, and reflecting. The matrix breaks down complex thinking into simpler, manageable parts. It focuses on four key areas:

- Understanding: Comprehending basic ideas.
- Analysing: Breaking down information into smaller pieces.
- Evaluating: Judging the quality or validity of information.
- Drawing conclusions: Make decisions based on your analysis and evaluation.
By using this structured approach, the matrix helps individuals improve their problem-solving and decision-making skills. It encourages a deeper, more organised way of thinking, allowing people to tackle challenges with greater clarity and insight.
Creative Thinking Flowchart
A Creative Thinking Flowchart is a visual tool that illustrates the steps involved in the creative thinking process. It is structured as a flowchart, where each step (e.g., idea generation, evaluation, problem-solving) leads to the next in a logical sequence. The elements are as follows:
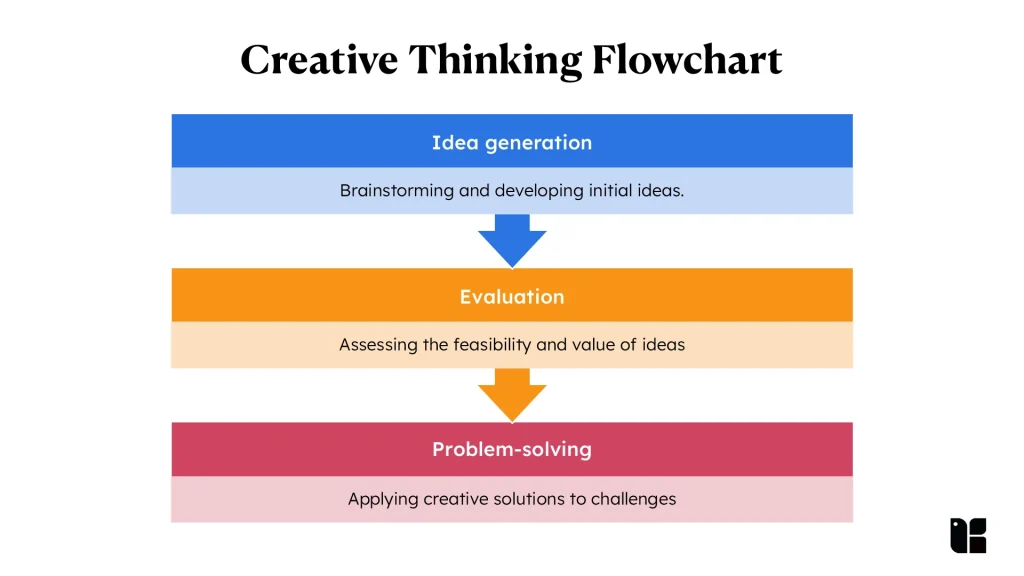
- Idea generation: Brainstorming and developing initial ideas.
- Evaluation: Assessing the feasibility and value of ideas.
- Problem-solving: Applying creative solutions to challenges.
This tool offers a structured approach to foster creativity and innovation, ensuring that each stage of creative thinking is addressed systematically. Guiding individuals and teams through a clear process helps develop new ideas and solutions in an organised and efficient way.
Q-Chart
The Q Chart is a two-column chart used to organise and clarify complex concepts. It lists key questions in one column and answers or responses in the other, creating a clear structure for inquiry and response. The elements are as follows:
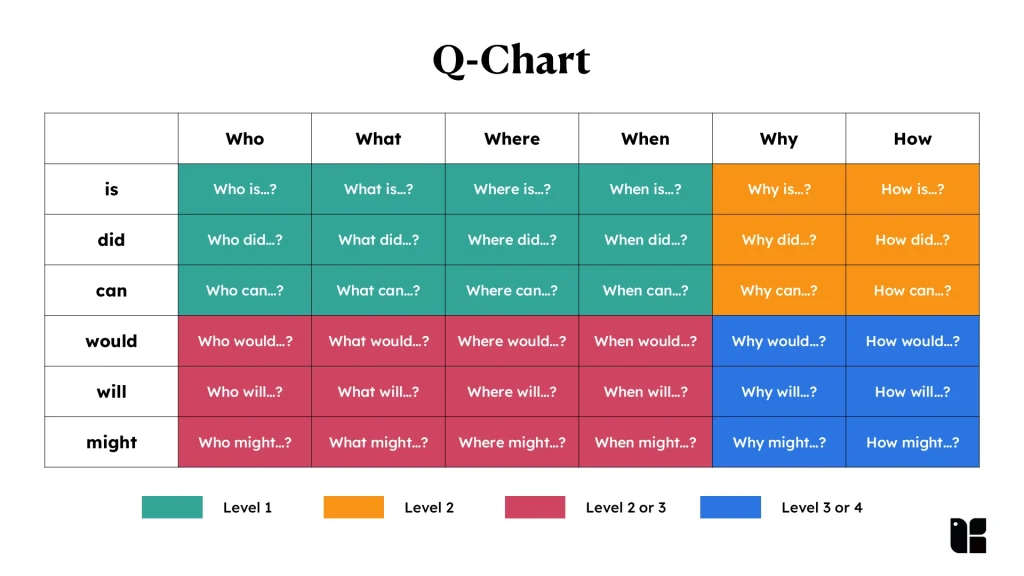
- Questions: Key inquiries related to a topic or problem.
- Answers/Responses: Solutions or explanations to the posed questions.
This tool organises complex information by breaking it into manageable questions and answers, making it easier to understand. It encourages critical thinking by emphasising the importance of asking the right questions. Particularly useful in research, discussions, and problem-solving, it helps clarify concepts and ideas, fostering deeper insights.
T Chart
The T Chart is a two-column chart used for comparing and contrasting information. The chart is divided by a vertical line, with one column listing pros or advantages and the other listing cons or disadvantages. The elements are as follows:
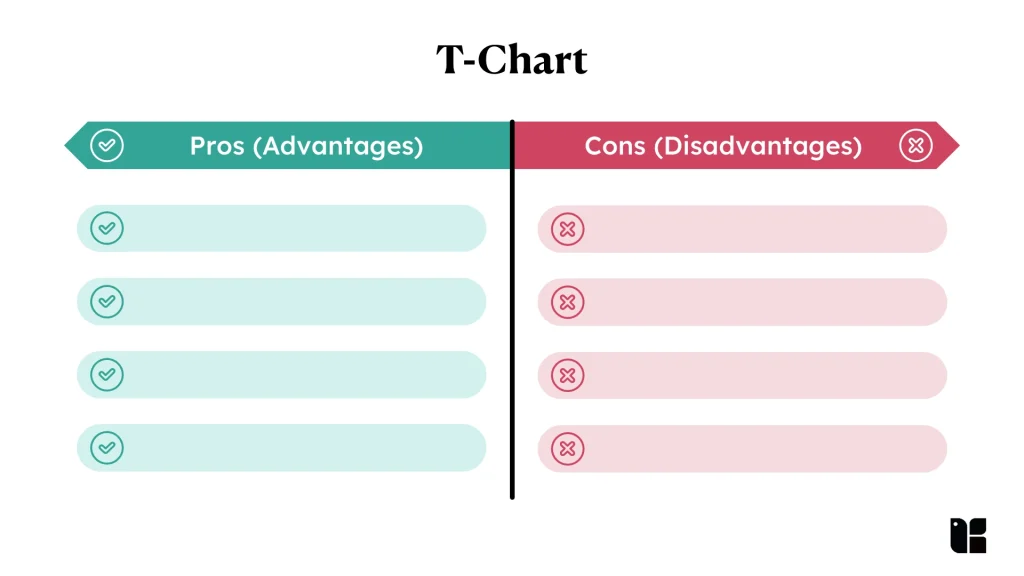
- Pros (Advantages): Positive aspects of a concept or situation.
- Cons (Disadvantages): Negative aspects or drawbacks.
A comparison chart is a valuable tool for evaluating different options, as it clearly outlines the advantages and disadvantages of each choice. By presenting key points side by side, it simplifies the decision-making process and aids in thorough analysis. This tool is particularly useful for brainstorming, helping individuals to weigh various alternatives and make informed decisions based on a clear and structured comparison.
After exploring the different types of charts, let’s now examine the benefits of using charts to enhance HOTS.
Gain insights into Kapable’s training approach that helps professionals use thinking frameworks to analyse situations, evaluate alternatives, and make better decisions.
What Are The Benefits Of Using Charts For Higher-Order Thinking Skills?
Charts are powerful tools in education, offering a dynamic way to simplify and enhance learning experiences while fostering critical and analytical thinking. The benefits are as follows:

- Breaking down complex ideas: Charts transform complicated concepts into visually digestible elements, making them easier for learners to understand.
- Enhancing memory: By presenting information visually, charts help learners retain key details and develop a deeper comprehension of the subject matter.
- Encouraging active engagement: Visual representation through charts captures the attention of both educators and learners, fostering a more interactive learning environment.
- Organising thought processes: Charts provide a systematic way to organise ideas and steps, serving as a helpful guide in nurturing higher-order thinking skills.
With the benefits of HOTS charts clear, let’s now look at how to use them effectively to achieve the best results.
How To Use Higher Order Thinking Skills Charts Effectively?
HOTS (Higher-Order Thinking Skills) charts are super helpful tools for getting people to think beyond surface-level ideas. They’re great for fostering skills like analysing, evaluating, and creating things we need to really dive deep into a subject. To use them well, though, you want to follow a few key steps to make sure everyone gets the most out of them. Here’s how to maximise their impact:

Understand And Introduce The Chart
Before jumping in, it’s important to know exactly why you’re using the chart. HOTS charts are all about moving past simple recall and into the kind of thinking that makes us really understand something. When you introduce the chart, make sure to explain its purpose and how each part works. Provide some simple examples, such as breaking down a current event or analysing a character’s actions in a story, to clarify the process, so people aren’t left wondering what to do next.
Goal Alignment And Application
Make sure the chart fits with the specific goals you’re working toward. For example, if you’re teaching problem-solving in a business setting, you can use the chart to break down case studies or strategies. Relating it to real-world problems helps people see how these skills apply outside the classroom. The more practical the examples, the better the engagement.
Encourage Active Participation And Questioning
Don’t let the group just sit there; get them talking! Whether through group work or discussions, encourage people to think out loud and explore different ideas. Ask questions that make them dig deeper into their thinking, like “What do you think the results would be if we did it differently?” or “Can you find another way to solve this?” It’ll help them get more involved in the process.
Guide, Reflect And Practice
As everyone works through the chart, stay close to guide them when they get stuck. Offer feedback that’s clear and constructive, helping them get better at thinking critically. Afterwards, take a step back and reflect on the experience what went well, what can be improved, and what can be done differently next time. The more you practice with HOTS charts, the sharper your thinking skills will become.
Now that we’ve explored the effective application of HOTS charts, let’s look at do’s and sdon’ts for Using HOTS Charts Effectively.
How Can HOTS Charts Be Used Effectively?
HOTS (Higher Order Thinking Skills) charts are an excellent tool to encourage deep thinking, reflection, and collaborative problem-solving. To make the most of this tool, it’s important to follow certain best practices while avoiding common pitfalls. Below are some key do’s and don’ts to guide you in using HOTS charts effectively:

Do’s For Using HOTS Charts Effectively
HOTS charts are a powerful tool for fostering deeper analysis and critical thinking. To ensure you’re maximising their potential, follow these best practices:
- Clarify the purpose: Clearly explain the chart’s goal. Example: “We’ll use this chart to analyse a recent event from different viewpoints, logical, emotional, and factual.”
- Encourage group interaction: Promote idea-sharing. Example: “What would you do in this situation? Let’s brainstorm approaches together.”
- Use relevant real-life examples: Connect the chart to real-world scenarios. Example: “Let’s apply this chart to a current business trend and evaluate its market impact.”
- Allow for reflection: Give time for self-assessment. Example: “Take a moment to reflect on your solution, what did you consider, and what might you have missed?”
Don’ts For Using HOTS Charts Effectively
While HOTS charts can be highly effective, avoiding common pitfalls will ensure a productive discussion. Here are some mistakes to steer clear of:
- Avoid skipping the basics: Explain the chart’s structure before use.
- Don’t overpower the discussion: Encourage everyone to share. Example: “What if we looked at this from a different angle?”
- Don’t make it too complex: Keep examples clear and manageable.
- Don’t rush the thought process: Allow time for deep reflection. Example: “Take your time with each section, consider all angles before moving on.”
After exploring the do’s and don’ts of HOTS charts, let’s dive into some tools that can help you create and manage them more efficiently.
Which Tools Help In Creating Higher-Order Thinking Skills Charts?
Creating clear and engaging Higher-Order Thinking Skills (HOTS) charts requires choosing the right tools. Here are some platforms and software that can help you design and tailor HOTS charts to your specific needs:
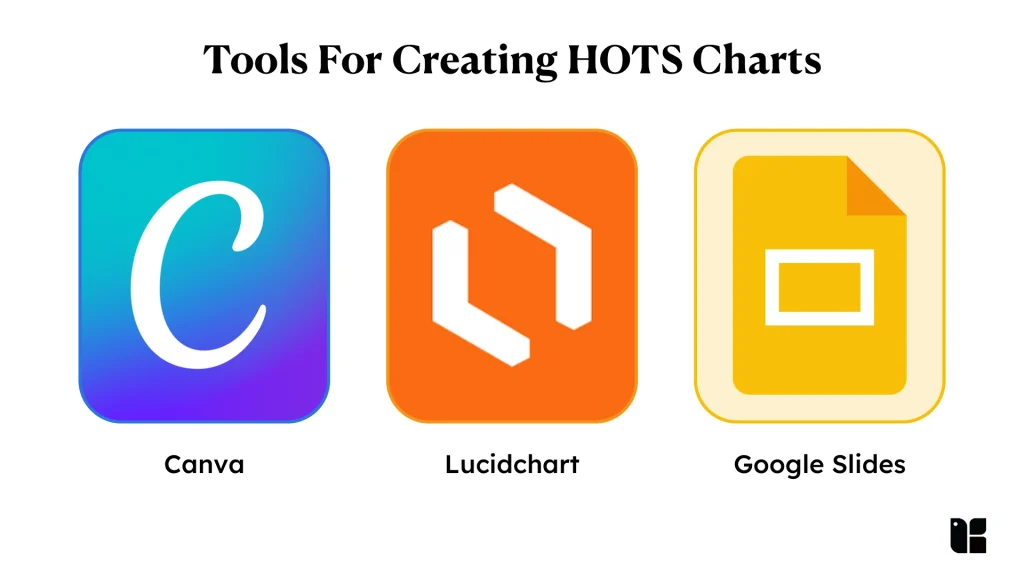
Canva
Canva is a versatile graphic design tool that simplifies the process of creating professional-looking charts and infographics. Its wide selection of templates and easy drag-and-drop interface make it ideal for users looking to quickly produce visually engaging HOTS charts without extensive design skills.
Lucidchart
Lucidchart excels in creating detailed diagrams, including flowcharts and mind maps, that are perfect for outlining complex thinking processes. It offers customisable templates and collaborative features, making it a great tool for teams working on HOTS charts together.
Google Slides
While primarily known as a presentation tool, Google Slides also serves as an excellent platform for creating simple, interactive HOTS charts. Its flexibility with shapes, lines, and text customisation allows you to craft charts that can be easily shared and presented in an educational setting.
Conclusion
HOTS charts are powerful tools that simplify complex concepts and promote critical thinking, creativity, and problem-solving. By breaking down ideas visually, they engage individuals in deeper analysis and application of knowledge. When used effectively, these charts encourage active learning and help develop essential skills for navigating complex challenges.
Before committing to a leadership development program, review Kapable’s program fit to understand whether it supports your current learning needs.


