

Executive presence is no longer a vague compliment traded in leadership talent reviews. It is a measurable leadership capability tied directly to decision making, business impact, and career advancement. To measure executive presence in your leaders, you evaluate the perception gap between how a leader intends to come across and how their stakeholders actually experience them, using 360-degree feedback, behaviourally-anchored observation rubrics, and self-assessment, triangulated together into a score you can track. This guide gives HR and L&D leaders the behaviours, tools, rating scales and KPIs to do exactly that, adapted for Indian organisations, so measurement stays fair to how presence actually reads in an Indian corporate context.
Why Measuring Executive Presence Matters Now
Most organisations talk endlessly about how to build executive presence without knowing how to measure it. Between hybrid work, faster decision cycles, and higher stakeholder scrutiny in 2024–2026, gut-feel evaluation of leadership presence is over. Leaders and leadership teams need a measurement-focused roadmap: the specific behaviours, tools, and metrics that let you assess, develop, and track executive presence over time. Done well, it helps leaders inspire confidence and improve leadership effectiveness.
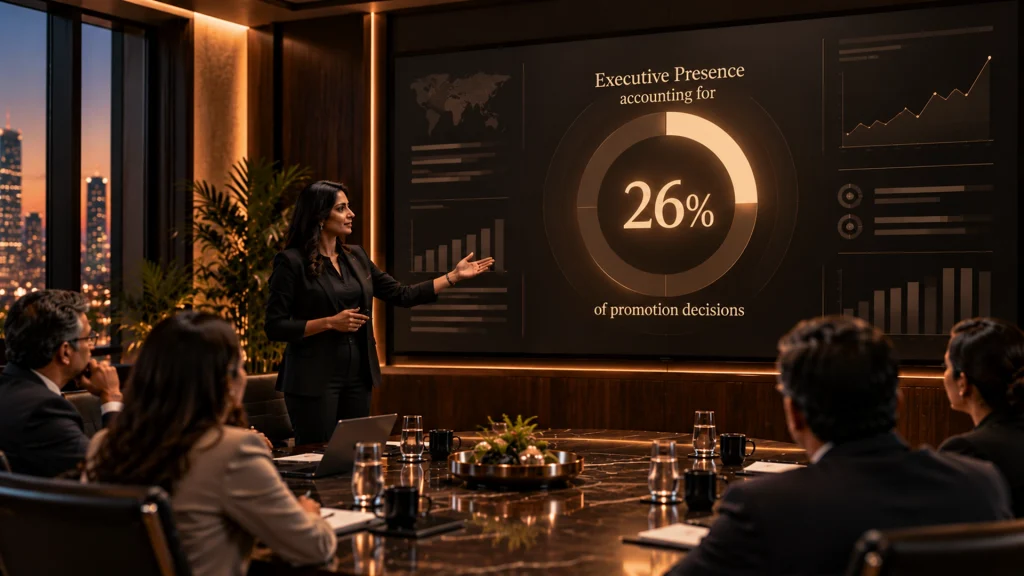
The stakes for leadership are concrete. In Sylvia Ann Hewlett’s research for Coqual (formerly the Center for Talent Innovation), the 268 senior executives surveyed said executive presence accounts for 26% of what it takes to get promoted. A quarter of the promotion decision resting on something most companies never score.
What you’ll learn in this guide:
- A behavioural model that breaks executive presence into four measurable dimensions
- Concrete indicators you can rate in real meetings and artefacts
- Assessment tools, rating scales, and KPIs to set baselines and track progress
- How Indian organisations adapt Western frameworks so measurement stays fair
- What measurement costs, in rupees, and how executive coaching turns scores into growth
The episode asks how to build presence when you are mostly remote. This guide asks the next question: how do you know it is working?
What Executive Presence Is (Before You Measure It)
“You’ll know it when you see it” is not a definition. It is a bias generator. When organisations leave executive presence undefined, they default to surface-level cues like polish, accent, or wardrobe, and they penalise leaders who don’t fit a narrow mould.
Executive presence is the consistent set of leadership behaviours that make others trust your judgement, follow your lead, and hand you bigger responsibilities. It combines character, gravitas, and communication skills, and effective leaders project authority and credibility through it. Executive presence can be measured as a leadership capability, not just admired as a personality trait, and the weighting of executive presence is now well evidenced.
According to Coqual’s research (a US-based global study; the India-specific read follows in the adaptation section), senior executives rate gravitas as 67% of executive presence, communication as 28%, and appearance as just 5%. That single finding should reset any measurement system: if appearance barely registers, a leadership scorecard that over-indexes on polish is measuring the wrong 5% of executive presence.
Why this number, and does it apply to you: the 67/28/5 split came from 268 senior evaluators inside a survey of roughly 4,000 professionals, the people who actually sign off on promotions. It tells you where to put measurement weight, not that appearance is worthless. Appearance still acts as a first filter through which gravitas and communication become visible; it simply should not dominate the rubric. For an Indian leadership pipeline, the practical read is to score substance (judgement under pressure, clarity, trust) heavily and treat grooming or accent as entry-level hygiene, never as a presence rating in itself.
The Four Measurable Dimensions
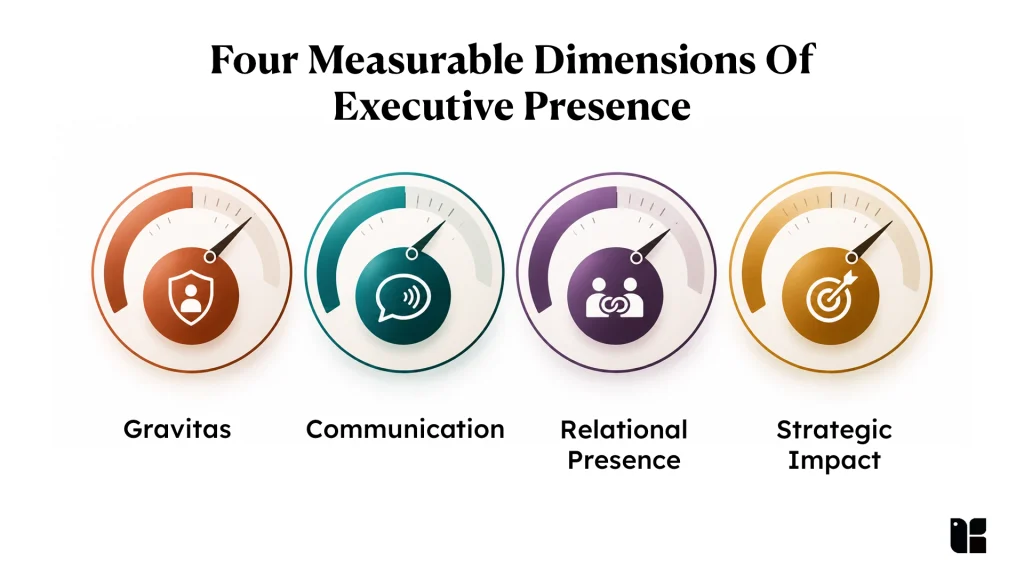
This definition is compatible with common models, including the widely cited 7 Cs of executive presence. Two versions circulate: Churchill Leadership Group publishes a trademarked 7 Cs of Executive Presence™ (competence, confidence, credibility, composure, connection, control, class), while a broader list (character, charisma, confidence, credibility, connection, composure, and clarity) is articulated by the business school IMD and circulated via Forbes with character as its foundation. For measurement, the framework used throughout this guide breaks presence into four assessable dimensions:
- Gravitas and decision making: visible composure, quality of judgement, and emotional control under pressure
- Communication and clarity: the ability to communicate effectively, adapt communication style, and structure messages for impact
- Relational presence and building trust: emotional intelligence, authenticity, and the capacity to listen actively and read subtle emotional cues
- Strategic impact and business orientation: enterprise-level thinking, connecting decisions to organisational influence, and anticipating downstream consequences
Each dimension connects to trackable outcomes: gravitas reduces decision cycle time, communication clarity reduces escalation volume, relational presence improves team engagement, and strategic impact accelerates milestone delivery.
How to Measure Executive Presence in Leaders: The Core Methods
How is executive presence measured in leaders? Through four methods used together: 360-degree multi-rater feedback for perception, behaviourally-anchored rubrics for observed behaviour, self-assessment to surface blind spots, and hard performance data (decision cycle time, escalation volume, stakeholder-trust pulse scores) for impact. No single tool is enough; executive presence measurement is the triangulation of all four.
Where that leaves a one-survey shortcut: most programmes fail because they run a single 360 and call it a system. A 360 captures perception on a given day; it misses behavioural frequency, context, and how executive presence holds under stress. A defensible programme reads three signals against each other: rater perception, observed behaviour, and self-view, and treats the gaps as the finding, not noise.
360-Degree Feedback and Multi-Rater Assessment
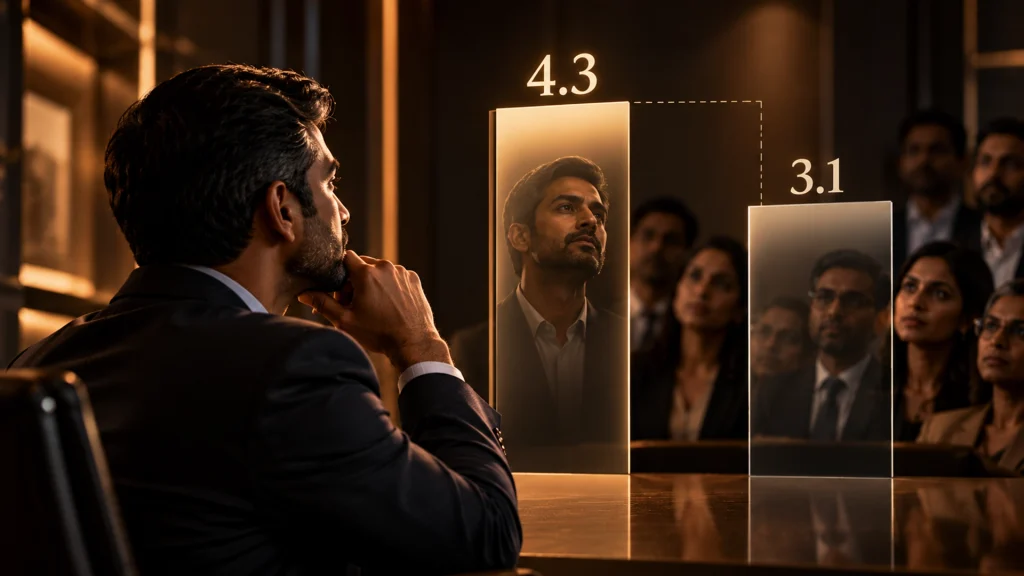
360-degree feedback collects perceptions from peers, direct reports, and managers. Self-assessment combined with multi-rater feedback highlights perception gaps, the distance between how a leader sees themselves and how others see them, which is often the single most useful measurement output. Instruments like the Bates ExPI™ use 90 behaviourally-verified items across 3 dimensions and 15 facets (character, substance, and style) to rate presence specifically, rather than borrowing a generic competency survey (in India, a Bates ExPI™ 360 typically runs ₹15,000–45,000 per leader). Interpreting the gap is the point: a leader who rates their own gravitas 4.3 while their raters average 3.1 has a 1.2-point perception gap, a specific, measurable signal that becomes the first coaching conversation, not a vague sense that they “need more presence.”
“Earlier, when I had several ideas in my head, they would often come out without much structure, and I would explain more than necessary. Kapable helped me become much more conscious of how I communicate. I started structuring my thoughts before I spoke, slowing down to choose my words more carefully, and reviewing my own sales calls to identify filler words and areas where I could be more concise. Over time, this has given me a clearer understanding of how I want to communicate and how I want people to experience my presence.”
— Vivek Bolde, Sr. Account Manager
Behaviourally-Anchored Observation Rubrics
Score specific leadership events (board updates, crisis calls, town halls, investor briefings) using a rating scale with a behavioural example at each level. This is where executive presence measurement becomes defensible: instead of “good presence,” a rater marks an observed behaviour. Use a 1–5 scale anchored to what the leader actually did.
| Score | Behavioural anchor (gravitas example) |
| 1 – Low | Avoids the decision, over-defers, shows visible anxiety, gives contradictory positions |
| 3 – Medium | Makes the decision but delays disclosing trade-offs; composed but occasionally loses steadiness |
| 5 – High | Names the decision, criteria, and timeline before debate; stays calm under challenge; invites dissent but owns the call |
Self-Assessment and the Perception Gap
Self-assessment paired with coaching uncovers blind spots in self awareness and self management. It is most useful precisely where it disagrees with the multi-rater data; that delta is the executive coaching agenda. For an individual leader measuring their own presence, the honest move is to score yourself against the same behavioural anchors your raters use, then compare: leaders who overrate themselves on gravitas are usually the ones stakeholders find hardest to trust, because the gap itself signals low self awareness. As an illustration of closing it: a leader who self-rated gravitas 4.5 against a rater average of 2.8 spent one quarter on just two behaviours (naming the decision before debate, and holding a steady tone under challenge) and pulled the rater average to within 0.5 of their self-rating by the next review.
Quantitative vs Qualitative: Choosing Your Approach
The word “measure” pulls people toward numbers, but executive presence needs both. Quantitative methods (1–5 anchored rubrics, decision-closure rates, trust pulse scores) give comparability and trend lines; qualitative methods (observation notes, verbatim stakeholder comments, coaching reflections) give the why. A mature system uses numbers to spot movement and qualitative data to explain it, never one alone.
When numbers alone mislead: a leader can score 4.2/5 on a rubric and still be quietly distrusted, because a five-point scale flattens context. Purely quantitative scoring also invites rank-ordering, which turns a development tool into a competition and pushes leaders to game the measure rather than close real gaps. Pair every score with one observed example and one stakeholder comment, or the number will read as more objective than it is.
The Four Dimensions and What to Score
Before the behaviours, here is how to weight the four dimensions and how many items each needs, a summary you can lift straight into a scorecard. These weights are the guide’s own recommendation, informed by Coqual’s finding that gravitas matters most (67%) and appearance least (5%), but redistributed across four operational dimensions rather than mirroring the three-pillar split directly.
| Dimension | Suggested weight | Items to score | Primary data source |
| Gravitas & decision making | 35% | 4–5 | Observation rubric + decision-cycle data |
| Communication & clarity | 30% | 3–4 | Observation + meeting artefacts |
| Relational presence & trust | 25% | 3–4 | 360 building-trust items |
| Strategic impact & business orientation | 10% | 2–3 | Proposal/ROI review + milestone delivery |
Each dimension below lists observable micro-behaviours you rate against a 1–5 anchor rather than a personality label.
Gravitas and Decision Making
Gravitas reflects a leader’s composure in high-pressure situations: visible steadiness and quality of judgement, not dominance or volume. Observable behaviours you can score:
- Names the decision, the options, and the trade-off before inviting debate
- Maintains a calm tone and body language when challenged during cost-cutting discussions
- Admits uncertainty, invites dissent, and reflects on mistakes while still closing the decision
- Foresees downstream consequences (talent retention, brand perception, regulatory exposure)
- Closes decision loops: communicates the outcome, rationale, and next steps within 24 hours
Gravitas connects directly to measurable outcomes: reduced time-to-decision, clearer ownership, and lower escalation volume. Emotional intelligence under pressure, reading the room while making the call, is a critical part of decision quality and should be scored alongside judgement.
Communication and Clarity
Leaders are judged as much by how they communicate decisions as by the decisions themselves. Communication is one of the fastest levers to develop, especially in hybrid and global teams. Concrete indicators:
- Uses outcome-first openings: states purpose, decision, and timing in under 60 seconds
- Structures updates using a consistent pattern (context–options–decision–next steps)
- Adapts the message for board versus frontline without losing the throughline
- Keeps executive summaries to one screen and email subject lines action-first
Track the share of meetings with documented decisions, clarification questions after presentations, and follow-up emails needed to restate a message. A 2026 study from Bar-Ilan University and Michigan State University (Segal, Lary, Schmaelzle & Ben-Zion) analysed 1,239 TED Talk transcripts from 2006 to 2013. It found that AI-rated clarity of explanation was the strongest predictor of audience likes and views. The full model, which also included talk duration, topic and scientific status, explained 29% of the variance in likes, and clarity added about 9.5 percentage points beyond those other factors. This suggests clarity can be assessed systematically from what a speaker says, which supports scoring it with a rubric.
Relational Presence and Building Trust
Relational warmth and inclusion separate authentic executive presence from “performing” confidence. Emotional intelligence is crucial here: leaders with high emotional intelligence inspire trust and collaboration, manage their own emotions, and read subtle emotional cues, connecting inner values to executive presence outward. Observable behaviours:
- Explicitly credits contributors by name in quarterly business reviews and town halls
- Asks for dissenting views before finalising transformation decisions
- Runs inclusive meetings where airtime is distributed and interruptions are managed
- Builds strong relationships across levels, not just upward
Authenticity rests on consistency between words and actions: when teams see alignment, stakeholder trust compounds and strong leaders inspire confidence across levels. Outcomes to track: voluntary turnover, 360 building-trust scores, engagement, and stakeholder confidence pulse scores. Set a concrete bar so relational presence is scored, not just described. For example, a target of at least 4.2 out of 5 on the 360 ‘building trust’ items, reviewed each quarter.
Strategic Impact and Business Orientation
Senior executives and senior leaders are judged on whether they think and communicate at enterprise level, not only within their function. Concrete behaviours showing strategic impact:
- Links proposals to 12–24 month business impact (revenue, margin, risk, customer outcomes)
- Frames decisions as cross-functional trade-offs, not functional optimisation alone
- Anticipates second-order effects during planning cycles (talent, brand, operations)
Simple metrics: share of proposals with clear ROI logic, frequency of enterprise-wide considerations in writing, and long-term milestones hit versus functional-only targets. Set a target such as 80% of a leader’s proposals carrying explicit 12–24 month ROI logic, tracked in the talent review. This executive presence dimension separates high-potential senior leaders ready for career advancement from strong functional managers.

Executive Presence Assessment Tools and Instruments
Most leadership teams combine tools rather than rely on a single survey. Most guidance skips a straight comparison; here is one, with an India cost read for budget planning.
| Tool / method | What it measures | Best use case | Indicative cost (India) |
| 360-degree multi-rater (e.g. Bates ExPI™) | Perception across peers, reports, managers; 3 dimensions, 15 facets, 90 verified behaviours | Manager-to-senior-leader development | ₹15,000–45,000 per leader |
| Emotional-intelligence assessment (e.g. Genos EQ) | The expression/relational dimension | Diagnosing the “under-expressed” leader | ₹8,000–20,000 per leader |
| Behaviourally-anchored observation rubric | Observed behaviour in live high-stakes moments | Ongoing tracking; low tooling cost | Observer time only |
| External assessment centre | Presence under simulated pressure, multi-context | C-suite and succession decisions | ₹1.5–3 lakh per leader |
| Self-assessment + coaching | Blind spots, self awareness, the perception gap | Pairing with any of the above | Coaching fee |
Cost bands are indicative planning ranges for Indian organisations and vary by provider; confirm current quotes before budgeting.
The Bates ExPI™ is a research-based, multi-rater instrument built specifically for presence, which is why it outperforms a repurposed competency survey. For teams wanting a lightweight numeric standard, the Churchill Leadership Group sets a concrete bar: a leader with executive presence scores a minimum of 8 out of 10 across all seven of its metrics, covering dimensions such as decision efficacy, influence index, and team engagement.
Choosing the Right Tool for Your Organisation
Match the executive presence tool to the stake, not to budget alone: lightweight rubrics for individual contributors moving into management, validated 360s for the manager-to-senior-leader step, and external assessment centres only for C-suite and succession calls where the cost of a wrong read is highest. The costliest mistake is over-buying: a mid-size Indian IT services firm that ran full external assessment centres for first-time managers paid roughly 5x the per-insight cost of a validated 360 that would have told it the same thing. Depth should track the stake, not the appetite for data.
Watch: 5 Ways to Establish Executive Presence, a short, practical primer on the behaviours your rubric should score.
Setting a Baseline and Building a Measurement Plan
You cannot elevate executive presence without a baseline. Leaders and leadership teams need a clear starting snapshot before development begins.
Setting a baseline:
- Select 3–4 core dimensions and 10–12 specific behaviours to track
- Run an initial 360 or multi-rater survey focused on those behaviours in a defined window (e.g. a defined quarter)
- Collect hard data from recent meetings and artefacts: decision cycle times, meeting notes, one-pager quality
- Capture stakeholder perceptions via short pulse surveys on trust, clarity, and stakeholder confidence
Building a 6–12 month measurement plan:
- Choose 2–3 lead indicators and 2–3 lag indicators per leader
- Set quarterly review points with the leader, HR, and executive coach
- Decide in advance which 2 behaviours each leader will focus on per quarter to avoid dilution
- Align the plan with existing performance and talent review rhythms rather than adding a new process
This baseline is the foundation for tracking measurable progress and helps leaders refine executive presence with precision.
When your baseline quietly bakes in bias: if you set the baseline using only today’s high-performers as the standard, you anchor measurement to whoever got promoted under the old criteria, and systematically under-identify non-traditional leaders with different presence styles. The fix is to anchor anchors to behaviours and outcomes, not to incumbents.
Leading and Lagging Indicators of Executive Presence
Leading indicators capture daily leadership behaviours you can observe now; lagging indicators reflect accumulated executive presence impact over months.
| Leading indicators (monthly) | Lagging indicators (quarterly / annual) |
| Clarity of decision summaries in meetings | Stakeholder confidence ratings from pulse surveys or 360s |
| Percentage of meetings with documented next steps | Promotion and succession readiness |
| Frequency of explicit credit and accountability | Engagement and psychological-safety scores |
| Quality of stakeholder updates (structure, brevity) | Delivery of strategic milestones |
| Rate of asking for dissent or minority views | Voluntary turnover on the leader’s team |
| Public speaking effectiveness in town halls | Business-impact metrics tied to the leader’s remit |
Example targets with timeframes: “Reduce average time from issue raised to decision by 20% over three quarters”; “Increase ‘my leader communicates a clear direction’ in pulse surveys by 10 points within 12 months”; “Raise the share of proposals with cross-functional risk analysis from 30% to 80%.” Emotional intelligence shows up mostly in leading indicators; business impact surfaces in lagging ones. That is how leadership effectiveness becomes visible and trackable.
Measuring Executive Presence in Remote and Hybrid Settings

With hybrid work now permanent across Indian IT and professional services, a leader assessed only in the room can be blindsided when their presence collapses on video. Measure three modes separately from the start:
- In-room presence: the traditional observation setting
- Synchronous virtual presence: command on Zoom/Teams calls, where physical cues are stripped out
- Asynchronous written presence: clarity and authority in Slack, email, and written updates
The failure mode is averaging these executive presence modes into one score. A leader who commands a boardroom but goes flat on video should not receive one blended score that hides the weakness. Track speaking-time ratio on calls, decision-closure rate within virtual meetings, and post-meeting influence (“whose perspective most shaped the outcome”) as virtual-specific signals.
Worked example: a Bangalore fintech. One Bangalore-based fintech measured executive presence by tracking three numbers for each senior leader: speaking-time ratio in meetings they led (target 30–40%), decision-closure rate within the meeting (target 70% of agenda items resolved), and a post-meeting influence score from attendees. The result was counter-intuitive: their COO scored high on perceived gravitas but near-zero on actual influence on decisions: the room deferred to him socially but changed nothing based on his direction. Averaged into a single “presence” rating, that gap would have been invisible. Measured separately, it became the COO’s specific, trackable development goal.
Listen: The Essentials: Executive Presence (Harvard Business Review), HBR breaks presence into gravitas, communication, and appearance.
Listen: The Essentials: Executive Presence | HBR
Adapting Executive Presence Measurement for Indian Organisations
Cultural adaptation of executive presence measurement is not translation. Behaviours that signal gravitas in high-context communication cultures (controlled emotion, hierarchical deference, speaking last) can read as low presence when scored against a Western rubric built for low-context, direct-communication norms, and the reverse is equally true.
When a “validated” tool measures the wrong thing (the counter-case). The common assumption is that established instruments (the 7 Cs, the Bates ExPI, generic 360s) are universally valid. For Indian pipelines, that consensus fails in a specific and measurable way. Frameworks built in Western contexts code behaviours like “decisive speaking” or “taking up space” as presence, which systematically penalises Indian women leaders, regional-language speakers with accented English, and leaders from high-context communication cultures. Using such a tool unadapted embeds affinity bias into a measure that looks objective, the opposite of what measurement is for. The fix is parallel scoring criteria for context, not a single global scale, and auditing rating distributions by gender, region, and language before trusting any score. (This is a known limitation of universal frameworks, not an argument against measurement; see the pitfalls section.)
Two Indian pipelines show what adapted measurement looks like in practice:
- A three-tier system used inside a large Indian IT services leadership pipeline: monthly 15-minute “presence observations” by trained assessors during client meetings (behavioural frequency counts), quarterly 360s that score India-specific and global presence dimensions separately, and bi-annual simulated crisis scenarios scored on composure. This caught a high-potential leader whose stellar in-person presence disappeared in virtual client escalations, a gap a single annual 360 would have missed entirely.
- Benchmarking against your own leaders, not a generic norm: one large Indian IT firm had external observers score its top 5% of leaders across 12 presence behaviours to establish internal norms, then measured emerging leaders against those. Its high-performers scored 40% lower than Western norms on “commanding silence” but 60% higher on “synthesising group perspectives”, an illustration of how a generic framework would have mis-rated its best people.
What Executive Presence Measurement Costs in India
The principle: measurement depth should match the cost of getting the decision wrong. Spending assessment-centre money on a first-time manager is as wasteful as running an informal read on a CEO succession. (See the tool comparison table and Q11 for specific ₹ cost bands by tier.)
Common Pitfalls When Measuring Executive Presence
Poorly designed executive presence measurement can reinforce bias or push leaders to perform a persona instead of building authentic executive presence.
- Overvaluing style: weighting polish, accent, or wardrobe over judgement and business impact. Countermeasure: anchor ratings in observable behaviours, and remember appearance is only 5% of the construct.
- Confusing extroversion with presence: penalising quieter but highly effective leaders. Countermeasure: include written and asynchronous artefacts, not just live performance.
- Vague criteria: “command of the room” without defined behaviours yields inconsistent ratings. Countermeasure: define every rating level with a behavioural example.
- Ignoring bias in feedback data: gender, region, and cultural norms shape how raters perceive presence. Countermeasure: audit rating distributions regularly; compare leaders to a consistent standard, not to each other.
- The measurement-transparency trap: once leaders know which behaviours are scored, they perform them during assessment windows without internalising them, inflating scores that don’t correlate with real effectiveness. Countermeasure: mix announced and unannounced observation, and validate scores against business outcomes.
What executive presence looks like in a regulatory hearing differs from a product sprint. Build context-specific anchors, not one-size-fits-all scales.
Using Executive Coaching to Develop and Track Presence

Executive presence measurement without development creates frustration. Executive coaching turns assessment data into behaviour change.
An executive coach translates scores into 2–3 prioritised behaviours, uses real meetings as practice labs, and integrates communication skills, emotional intelligence, and self awareness work rather than surface tactics.
Structure engagements for measurement: pre- and post-assessments 6–9 months apart, monthly or quarterly mini-360s, and 1–2 numeric KPIs tied to business impact. Good executive coaching builds leadership presence from the inside out (character, mindset, self assurance) and the outside in (observable behaviours, body language, public speaking). This is where a structured programme like Kapable’s executive leadership development ties measurement to a defensible development plan.
Watch: How to Develop Executive Presence (Full Course), a deeper 2.5-hour walkthrough of the components a measurement system scores.
Designing a Simple Executive Presence Scorecard
A lightweight executive presence scorecard gives leadership and HR an at-a-glance view of progress. A one-page scorecard should carry the 3–4 core dimensions, 2–3 behaviours each with current rating, target rating, and example evidence, the leading and lagging indicators with trend lines, space for stakeholder and coach comments, and a “focus this quarter” line naming the 1–2 behaviours the leader will prioritise. Here is a worked row so the format is concrete (illustrative figures):
| Dimension | Behaviour (1–5 anchor) | Current | Target | Evidence |
| Gravitas | Names decision, criteria, timeline before debate; steady under challenge | 2.8 | 4.0 | Q1 board review: deferred the pricing call twice; visibly tense under CFO challenge |
| Communication | Outcome-first opening within 60 seconds | 3.5 | 4.5 | Town hall: clear ask, but buried it after three minutes of context |
Review it quarterly, decide which behaviours to continue, start, or stop, and use one structure across the senior leadership team so executive presence becomes a shared, measurable leadership standard tied to the leadership pipeline and succession planning.
A 6–12 Month Roadmap to Measure and Build Executive Presence

Executive presence can be measured, developed, and linked to business impact when defined behaviourally:
- Months 1–2: Define dimensions and behaviours; run baseline assessments; collect initial KPIs (target: baseline 360 response rate of at least 80% by the end of month 2).
- Months 3–4: Select 2 behaviours per leader; embed them in real meetings; start executive coaching with a measurement-first partner such as Kapable.
- Months 5–8: Track leading indicators monthly; run pulse surveys on clarity, trust, and confidence; adjust plans on the data.
- Months 9–12: Re-run assessments, compare to baseline, tie gains to decision speed (target: decision-cycle time down 10–15%), engagement, and milestone delivery.
- Ongoing: Treat executive presence measurement as a leadership habit, not a one-time project.
Start this week: pick one meeting and practise one measurable behaviour, then embed the metric into your next talent-review cycle.
“I used to measure leadership by how effectively I could get things done. Kapable helped me recognise that how I work with people is just as important to the outcome. I’ve become more deliberate about listening, understanding different perspectives and adapting my approach, while still giving people the clarity they need to move forward. That shift has changed not just how I communicate, but how I lead.”
— Mansoor Ali, Associate Vice President
Conclusion
Measuring executive presence in leaders comes down to a repeatable loop: define the behaviours, triangulate 360 feedback with observation and self-assessment, anchor every score to an observable action, adapt the criteria to your context, and tie the trend line to business outcomes. Do that, and executive presence stops being a talent-review adjective and becomes a leadership capability you can baseline, develop, and prove. Organisations that treat it this way build a leadership pipeline where the right leaders are seen, trusted, and promoted for the right reasons. Remember what is being measured: Coqual’s senior executives put executive presence at 26% of the promotion decision, so measuring it well means scoring roughly a quarter of who rises deliberately, rather than by instinct.
If you’re building a measurement-and-development programme for your leaders, Kapable’s Speakable programme pairs behavioural assessment with 1-on-1 coaching so communication scores translate into tracked growth. Explore related reading on senior leadership and the senior leadership programme.
Frequently Asked Questions
Q1. How can executive presence be measured or assessed?
Executive presence is measured by triangulating four methods: 360-degree multi-rater feedback (perception), behaviourally-anchored observation rubrics in real meetings (observed behaviour), self-assessment (the perception gap), and hard data such as decision cycle time and stakeholder confidence pulse scores (impact). No single method is enough; the gaps between them are the finding.
Q2. What are the 7 C’s of executive presence?
Two versions of the 7 Cs circulate. Churchill Leadership Group publishes a trademarked 7 Cs of Executive Presence™ (competence, confidence, credibility, composure, connection, control, class). A broader list (character, charisma, confidence, credibility, connection, composure, and clarity) is articulated by the business school IMD and circulated via Forbes, with character as the foundation. Both are descriptive rather than diagnostic. To measure the 7 Cs you still need a behavioural anchor and multi-rater data for each C.
Q3. What are the five Cs of executive presence?
The five Cs are usually character, competence, confidence, communication, and charisma, a popular short-form framing with no single definitive originator, circulated across leadership-training providers. They overlap heavily with the 7 Cs; use the five-C version for a lighter first-line-manager scorecard and the seven-C version for senior leaders who need finer distinctions. Either way, what matters is attaching an observable behaviour and a rating scale to each element.
Q4. What are the three C’s of executive presence?
The three Cs most often cited map to Hewlett’s three pillars: how you act (gravitas/character), how you speak (communication), and how you look (appearance), weighted 67%, 28%, and 5% respectively in Coqual’s research. For measurement, weight your rubric the same way: score substance heavily and treat appearance as a minor first filter of executive presence.
Q5. What are the key qualities and dimensions of executive presence to measure?
The measurable dimensions are gravitas and decision making, communication and clarity, relational presence and trust, and strategic impact. The key qualities to score within them are composure under pressure, decisiveness, clarity, emotional intelligence, authenticity, and enterprise-level thinking, each rated against a behavioural anchor, not a personality label. For example, score composure as: maintains an even tone and redirects the discussion within 30 seconds of being challenged (a 4–5) versus becoming visibly rattled or defensive (a 1–2).
Q6. What are validated executive presence assessment tools?
Validated options include the Bates ExPI™ (a 90-item multi-rater instrument measuring 3 dimensions and 15 facets of executive presence), emotional-intelligence assessments such as Genos EQ, and structured 360s. Combine a validated survey with behaviourally-anchored observation and self-assessment; one instrument alone measures perception but misses behaviour under pressure. As a budget guide for India, 360-class instruments such as the Bates ExPI™ typically run ₹15,000–45,000 per leader and Genos EQ ₹8,000–20,000 per leader, often available through Indian consulting partners.
Q7. Who should evaluate executive presence in an organisation?
A defensible programme uses multiple raters (peers, reports, and managers via 360 feedback) plus one or two trained observers scoring live behaviour and the leader’s self-assessment. Keep observers calibrated on the same anchors and audit ratings for bias. The HR or L&D team owns the system; no single evaluator decides a score alone. For statistical reliability, aim for at least three peers and three direct reports per leader so no single rater skews the result.
Q8. Can self-assessment accurately measure executive presence?
Not on its own. Self-assessment matters precisely where it disagrees with multi-rater data; that perception gap is the executive coaching agenda. Leaders who overrate their gravitas are often the least trusted, because the gap signals low self awareness. Pair it with 360 feedback, never use it as a standalone score. A simple method: rate yourself 1–5 on five gravitas behaviours; compare against your 360 median on the same items using an instrument such as CCL Benchmarks® or Korn Ferry’s assessment; then treat any item where you sit more than 1.5 points above your raters as a priority coaching gap.
Q9. What is the 70-20-10 rule for leadership, and does it apply to measuring presence?
The 70-20-10 rule, developed by Morgan McCall, Michael Lombardo and Robert Eichinger at CCL and Lominger, holds that development is roughly 70% on-the-job experience, 20% from others (coaching, feedback), and 10% formal training (the exact ratios are a design principle, not an empirically validated formula). One way to apply it to executive presence measurement: put about 70% of your measurement weight on observed behaviour in live meetings and artefacts, 20% on structured 360 feedback, and 10% on formal simulation exercises, rather than judging presence only in a training-room role-play.
Q10. How often should executive presence be measured?
Baseline once, then track leading indicators monthly and lagging indicators quarterly, with a full re-assessment 6–9 months on. Monthly full 360s cause fatigue and show no movement; quarterly formal checks plus lightweight monthly observation is the sustainable rhythm for most Indian leadership pipelines.
Q11. What does executive presence assessment cost in India?
As a planning guide: informal observation costs mainly manager time; validated 360 tools run ₹15,000–45,000 per leader; external assessment centres run ₹1.5–3 lakh per leader. Match spend to the stake: rubrics for emerging managers, 360s for senior managers, assessment centres only for C-suite and succession.


